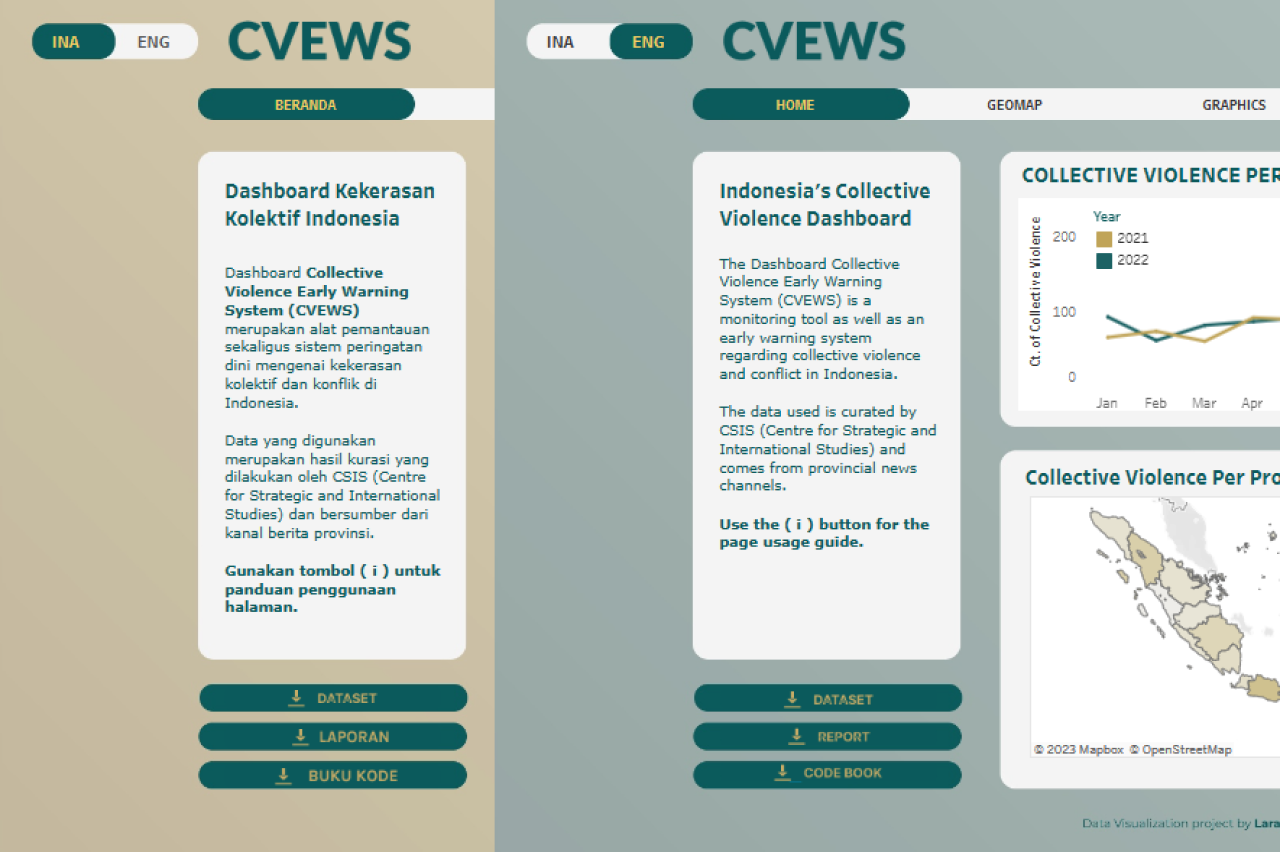
CVEWS Dashboard Project
Awarded for “Best Project I” ─ Interactive data visualization dashboard developed for Pacmann Student Hackathon 2023 in collaboration with CSIS. All copyright belongs to respective Authors.
Objective:
CVEWS Dashboard (Collective Violence Early Warning System Dashboard) was developed for Pacmann Student Hackathon 2023 in collaboration with CSIS. Partnering with Shofi Fajriah Ilmi for the span of the hackathon duration, we worked as a solid unit in cleaning, wrangling, visualizing data, and debugging. In account of CSIS as the data provider, our team paid close attention to their needs: an early warning system within a data visualization dashboard that also acts as a research dissemination page.
In order to fulfill all of those, we broke down the task into three parts. First, we developed a data visualization dashboard regarding collective violence across provinces in Indonesia. Second task was to develop an early warning system regarding collective violence issues, casualties, and intervention level across provinces in Indonesia. The third task was to ensure that the dashboard has a language button, information button, and download button to save the data shown on the dashboard. Lastly, to add a personal touch to the dashboard, we made sure to use CSIS color palette in creating custom buttons, layouting, and data visualization.
CVEWS Dashboard was awarded for “Best Project I” in the hackathon. Link for a Live Demo is provided the bottom of the page.
Vision:
- To create data visualization and early warning system regarding collective violence cases in Indonesia
Goal:
- Early Warning System.
- CVEWS Dashboard.
- Bilingual dashboard in Bahasa Indonesia and English. Overall development process takes about 13 days.
- Interactive Scatterplot. Feature allows user to adjust axis according to their needs.
User Persona:
- Indonesian Governmental Body
- National Police Force
- Private Institutions
- Academic Researchers (national & global)
- General Audience / Public

User-Flow:
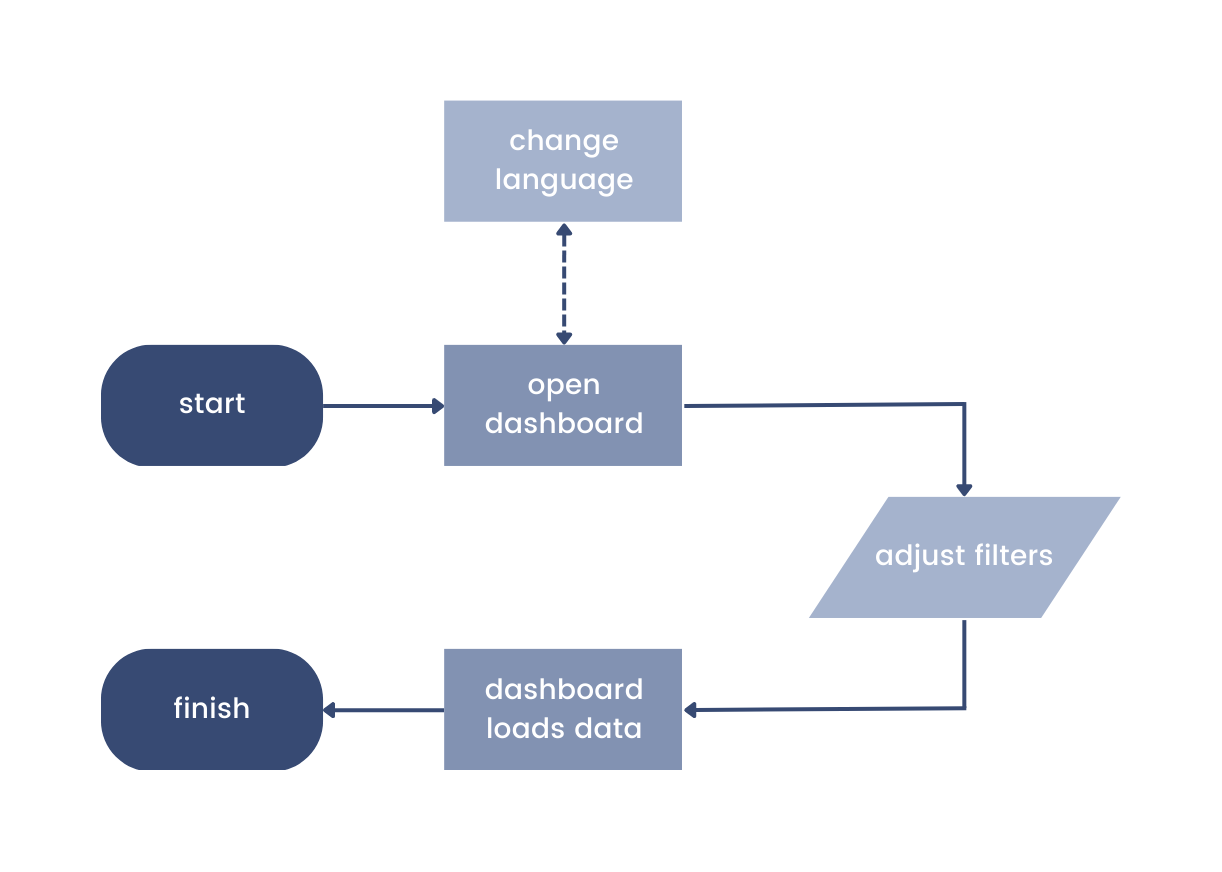
CVEWS Dashboard User-Flow. User-flow applies to all pages across CVEWS Dashboard.
Our simplified user-flow aims to achieve:
- Simple Dashboard Usage – Dashboard is easy to understand, navigate, and without clutter.
- Intuitive Filters – The displayed visualization adapts on the selected filters.
- Dissemination of Information – Download button for raw data, code book, and report is available on Main page. Each page has “Download as PDF” button to help spread dissemination of information to the public.

Dashboard Features:
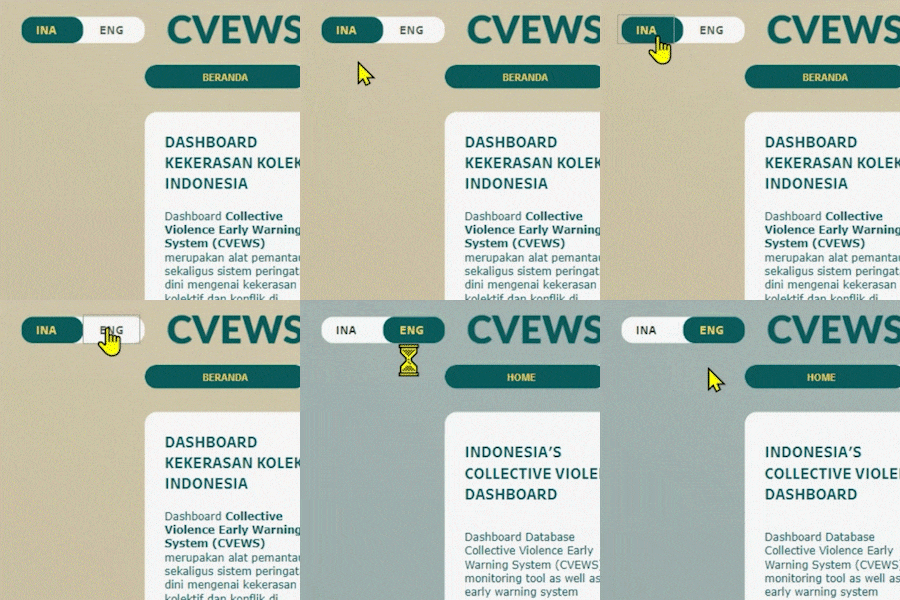
Language Button. Switch between Bahasa Indonesia and English.</centre>
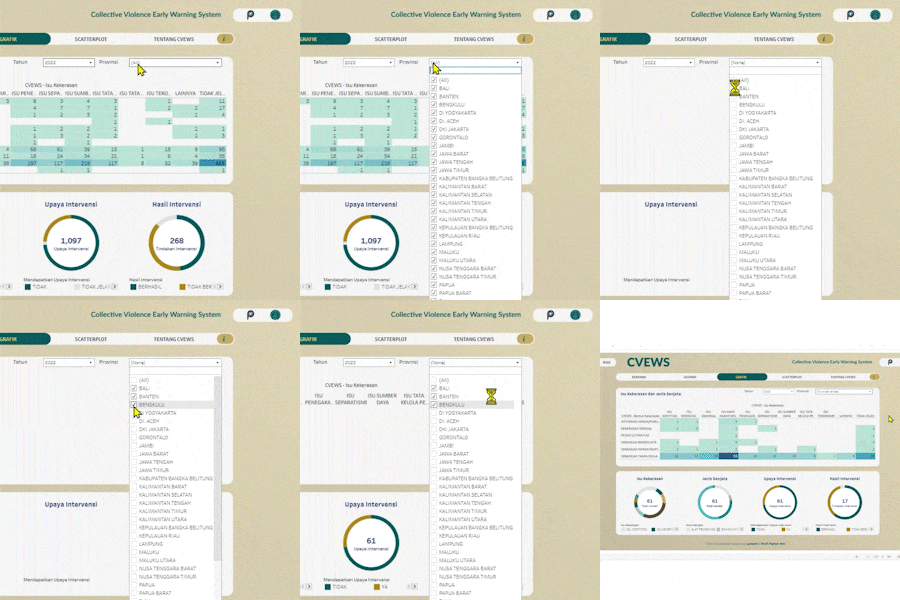
Filters. Filters act as central control to display information on the page.

Save as PDF Button. Capture the displayed data and save it as PDF.
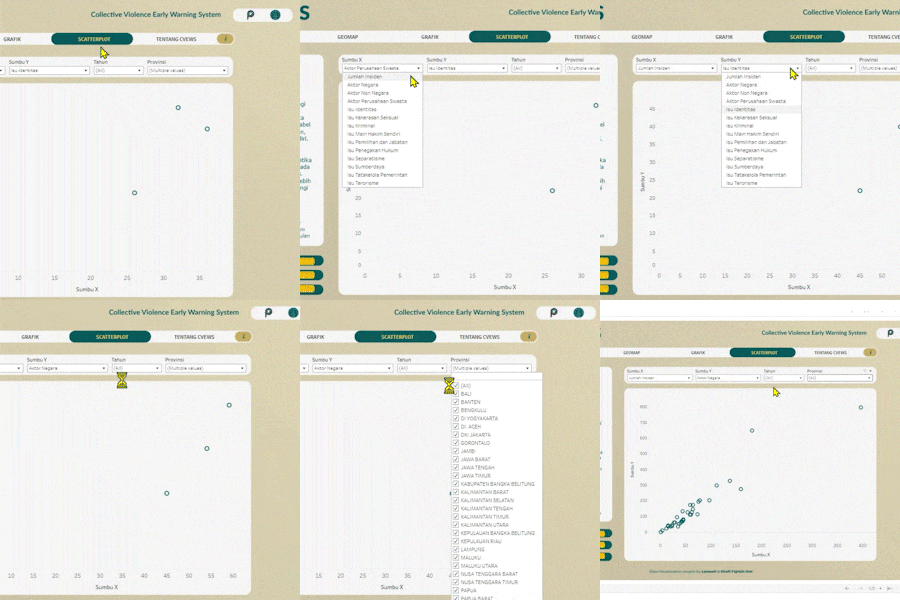
Interactive Scatterplot. Adjust X-Axis and Y-Axis according to User's needs.
Links:
- Live Demo (INA/ENG)
- Product Requirement Document (INA)
- MVP Presentation (INA)
- Developer’s Note (INA)