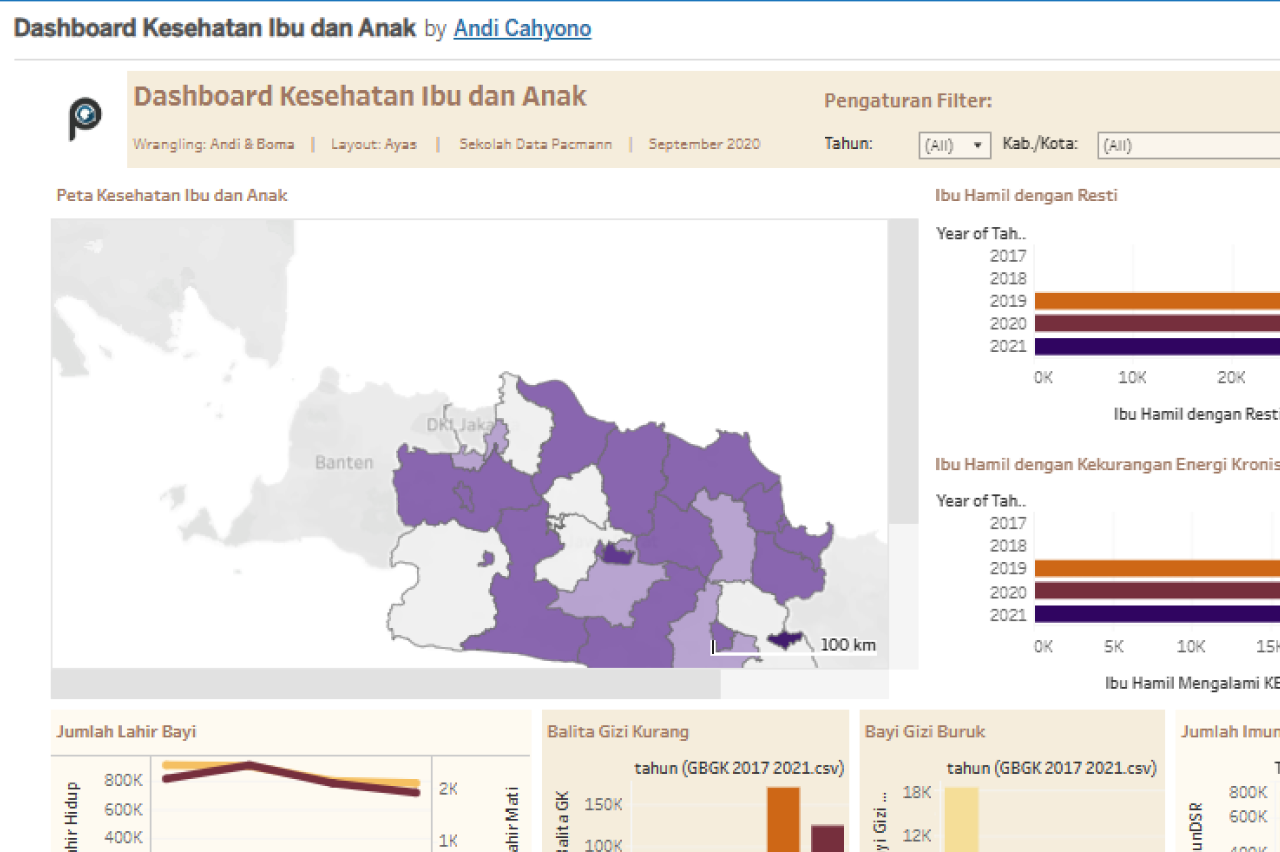
Dashboard Kesehatan Ibu dan Anak
Dashboard Kesehatan Ibu dan Anak developed for ‘Project Lab BI I’ course held by Pacmann.io. All copyright belongs to respective authors.
Students are given the opportunity to demonstrate their programming skills during Project Lab BI I. For this project, we were given a list of various datasets which we could choose from. I formed a team of three with Andi Cahyono and Dewandra Bomantara. We decided to choose mother and child’s health as our main issue.
We were tasked not only to develop a dashboard, but also to provide a solution to the issue that caught our eye. During the wrangling process, we saw how difficult it is to have a complete grasp of the data due to the incomplete data. There were long gap years and missing places. To answer the problem, we suggested to create a grass-root based data collection system to aid community-level health workers capture and report the data in real time.
Link for a Live Demo is provided the bottom of the page.
Vision
- To create a grass-root based health dashboard to increase visibility on mother and child’s haelth condition in West Java province.
Goals
- Dashboard Kesehatan Ibu dan Anak. Data visualization and analysis regarding mother and child’s health report in West Java. Dashboard takes about 3 days to develop.
- Grass-Root Based Data Collection. Develop a simple data-gathering application for grassroot health workers. Gathered data will be used to renew Dashboard information.
User Persona
- Posyandu Workers. Access to Data Collection App to collect and upload data.
- Puskesmas Workers. Access to Data Collection App to collect and upload data.
- General Audience / Public. Access to dashboard only.

Dataset Refference
Data sourced from opendata.jabarprov.go.id
- Jumlah Anak Usia 0-23 Bulan dengan Panjang Pertumbuhan Terindikasi Stunting (Merah) Berdasarkan Desa/Kelurahan di Jawa Barat
- Jumlah Balita bergizi kurang berdasarkan kabupaten/kota di Jawa Barat
- Jumlah Bayi Bergizi Buruk Berdasarkan Kabupaten/Kota di Jawa Barat
- Jumlah Bayi yang Diimunisasi Campak Berdasarkan Kabupaten/Kota di Jawa Barat
- Jumlah Imunisasi BCG Pada Bayi Berdasarkan Jenis Kelamin di Jawa Barat
- Jumlah ibu hamil berdasarkan kabupaten/kota di Jawa Barat
- Jumlah Ibu Hamil yang Mengalami Kekurangan Energi Kronis (KEK) Berdasarkan Desa/Kelurahan di Jawa Barat
- Jumlah Ibu Hamil yang Mengalami Resiko Tinggi Kehamilan (RESTI) Berdasarkan Desa/Kelurahan di Jawa Barat
- Jumlah Kejadian Kematian Bayi (0-12 Bulan) Berdasarkan Desa/Kelurahan di Jawa Barat
- Jumlah Orang Tua/Pengasuh yang Mengikuti Parenting Bulanan (PAUD) Berdasarkan Desa/Kelurahan di Jawa Barat

User-Flow
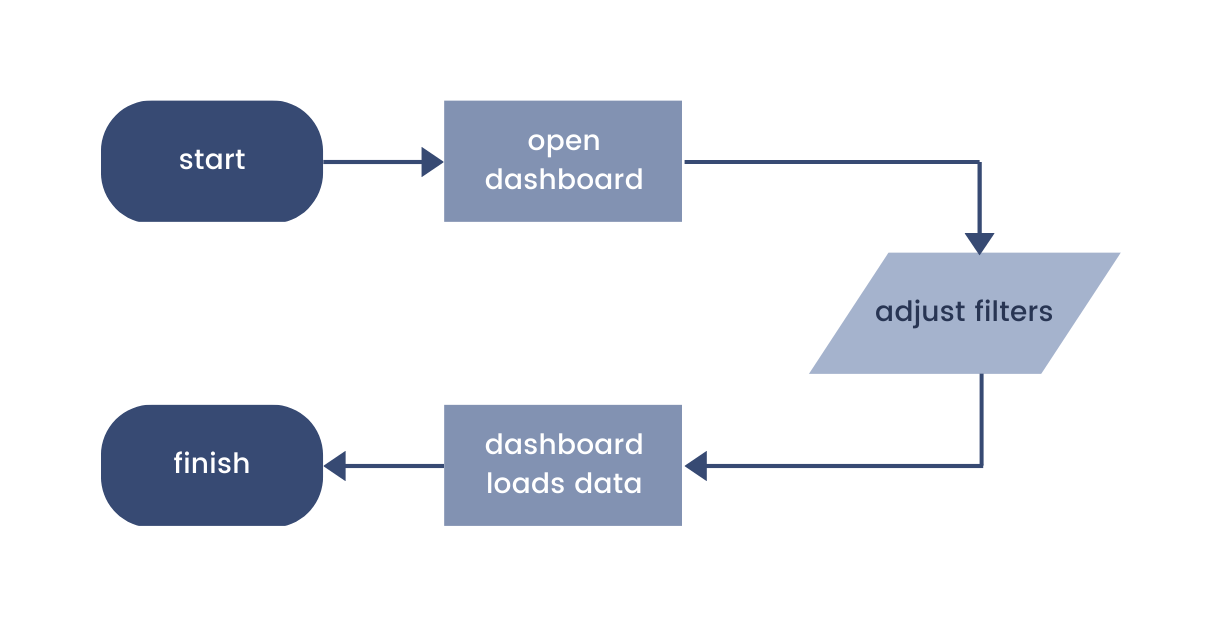
Dashboard User-Flow. Userflow applies to all pages across CVEWS Dashboard.
Simple Usage – Similar User-Flow for all departments.
Intuitive Filters – Adjust step in choosing department page and filters. Data on dashboard adapts based on adjustments on the filter.
Open for Improvements – Dashboard is always open for requests based on each department’s need. Requests will be queued on B.I. Team’s Pipeline.

Dashboard Features
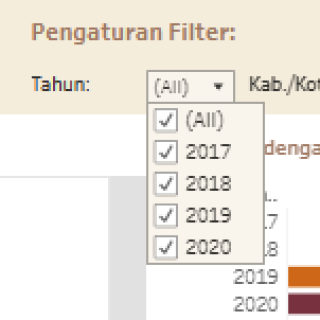
Control Panel. Main control to adjust information displayed on the dashboard.
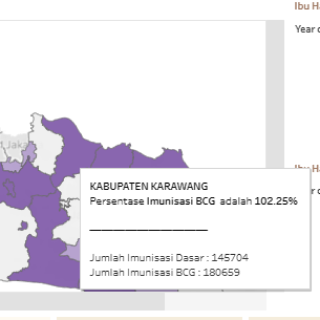
Geomap & Tooltip. Heatmap to aid visualization based on the selected data. Additional information shown as tooltip.
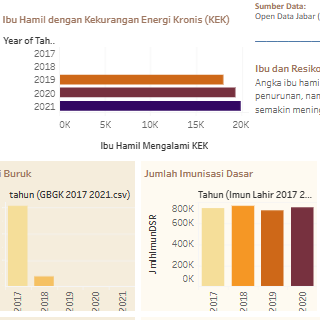
Bar Chart & Dual-Axis Chart. Data visualization to represent selected information.
Links:
- Live Demo (INA)
- Product Requirement Document (INA)
- MVP Presentation (INA)
- Final Report (INA)
- Grass-Root Data Collection App (INA)