Superstore Sales Dashboard
Superstore Sales Dashboard developed for ‘Business Intelligence/Data Analyst’ trial course held by Pacmann.io. All copyright belongs to respective authors.
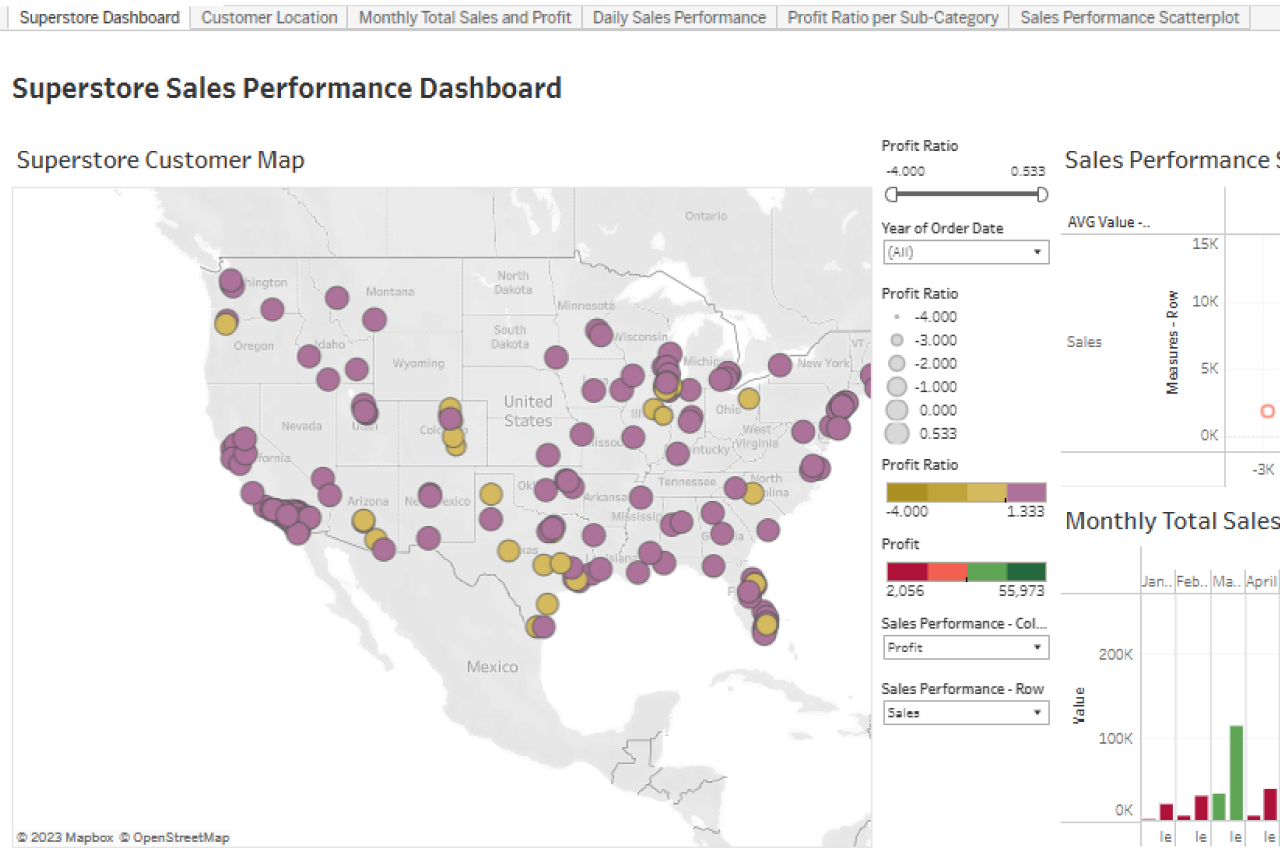
During our trial course, participants were given the chance to develop a company dashboard using a public sample dataset titled “Superstore Dataset”.
The dashboard has to be able to provide answers regarding number of sales per region, profit and revenue, and sales per-product category.
As my first dashboard, I exercised how to develop a geomap with circle marking to indicate profit per city, an interactive scatterplot that could be adjusted by the user, and a bar chart to view sales per month.
Link for a Live Demo is provided the bottom of the page.
Vision
- To create a grass-root based health dashboard to increase visibility on mother and child’s haelth condition in West Java province.
Goals
- Dashboard Kesehatan Ibu dan Anak. Dashboard takes about 3 days to develop.
- Grass-Root based data mining. Gathered data will be used to renew Dashboard information.
User Persona
- Posyandu Workers
- Puskesmas Workers – Posyandu & Puskesmas workers will be granted access to collect and upload data.
- General Audience / Public
Dataset Refference
Data sourced from opendata.jabarprov.go.id
- Jumlah Anak Usia 0-23 Bulan dengan Panjang Pertumbuhan Terindikasi Stunting (Merah) Berdasarkan Desa/Kelurahan di Jawa Barat
- Jumlah Balita bergizi kurang berdasarkan kabupaten/kota di Jawa Barat
- Jumlah Bayi Bergizi Buruk Berdasarkan Kabupaten/Kota di Jawa Barat
- Jumlah Bayi yang Diimunisasi Campak Berdasarkan Kabupaten/Kota di Jawa Barat
- Jumlah Imunisasi BCG Pada Bayi Berdasarkan Jenis Kelamin di Jawa Barat
- Jumlah ibu hamil berdasarkan kabupaten/kota di Jawa Barat
- Jumlah Ibu Hamil yang Mengalami Kekurangan Energi Kronis (KEK) Berdasarkan Desa/Kelurahan di Jawa Barat
- Jumlah Ibu Hamil yang Mengalami Resiko Tinggi Kehamilan (RESTI) Berdasarkan Desa/Kelurahan di Jawa Barat
- Jumlah Kejadian Kematian Bayi (0-12 Bulan) Berdasarkan Desa/Kelurahan di Jawa Barat
- Jumlah Orang Tua/Pengasuh yang Mengikuti Parenting Bulanan (PAUD) Berdasarkan Desa/Kelurahan di Jawa Barat
User-Flow
 Dashboard User-Flow. Userflow applies to all pages across CVEWS Dashboard.
Simple Usage – Similar User-Flow for all departments.
Intuitive Filters – Adjust step in choosing department page and filters. Data on dashboard adapts based on adjustments on the filter.
Open for Improvements – Dashboard is always open for requests based on each department’s need. Requests will be queued on B.I. Team’s Pipeline.
Dashboard Features
Control Panel – Main control panel to adjust information displayed within page. Feature is unavailable for Biz.Dev. department.
Geomap & Tooltip – Heatmap to aid visualization based on the selected data. Additional information shown as tooltip.
Bar Chart & Dual-Axis Chart – Data visualization to represent selected information.
Links:
- Live Demo (ENG))