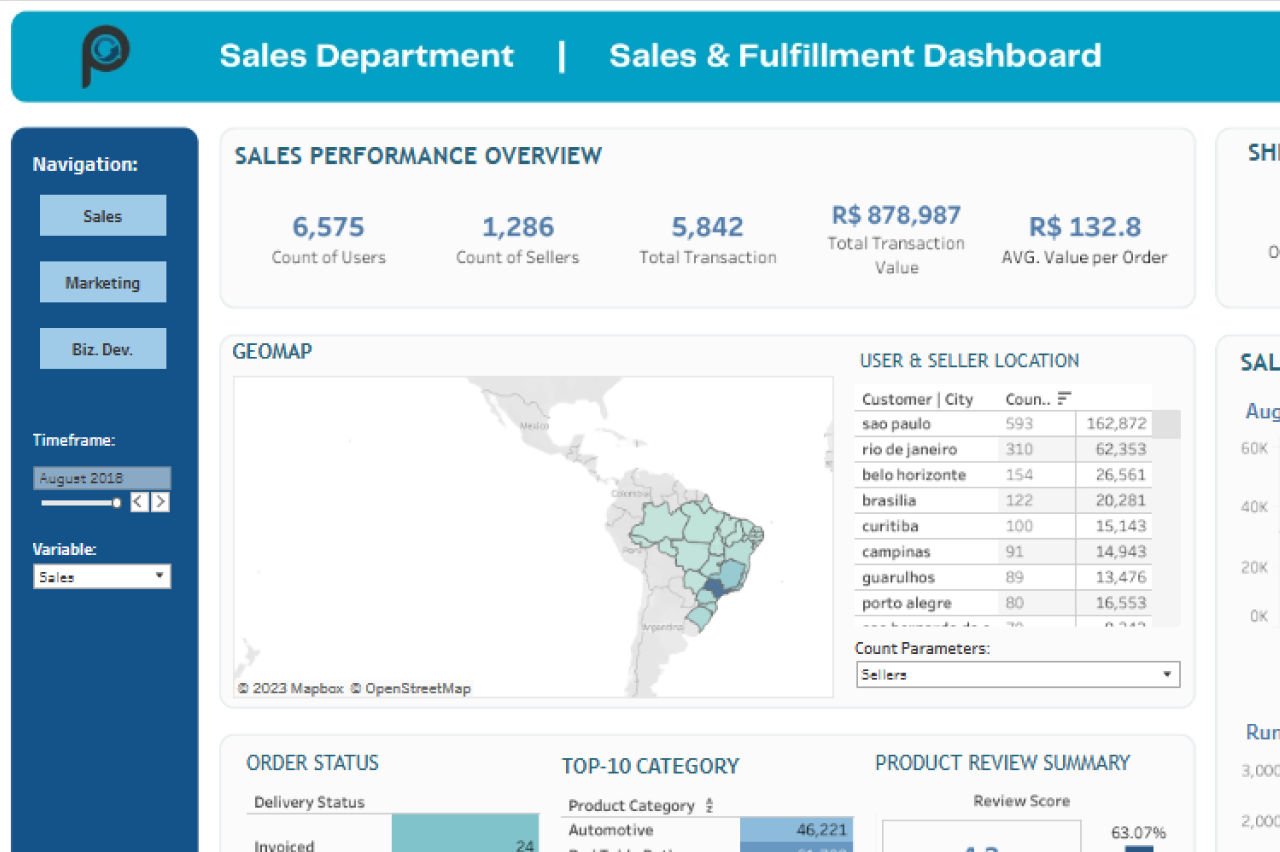
eCommerce Company Dashboard
eCommerce Company Dashboard developed ‘Project Lab BI II’ course held by Pacmann.io. All copyright belongs to respective authors.
As our final project of Project Lab BI II, students formed a group of 3 to develop a company dashboard which would be used to monitor 3 departments within the company. Our group consisted of Andi Cahyono, Dewandra Bomantara, and myself included. Each groups were given the same dataset of an eCommerce company based in Brazil.
Link for a Live Demo is provided the bottom of the page.
Vision
- To create a cross-departmental dashboard to increase visibility on each department performance.
Goals
- Sales Performance Dashboard
- Marketing Campaign Dashboard
- BizDev A/B Testing Dashboard.
Each dashboard takes about an average 2 days to develop.
User Persona
- C-Level and Management
- Sales Department
- Marketing Department
- BizDev Department

User-Flow
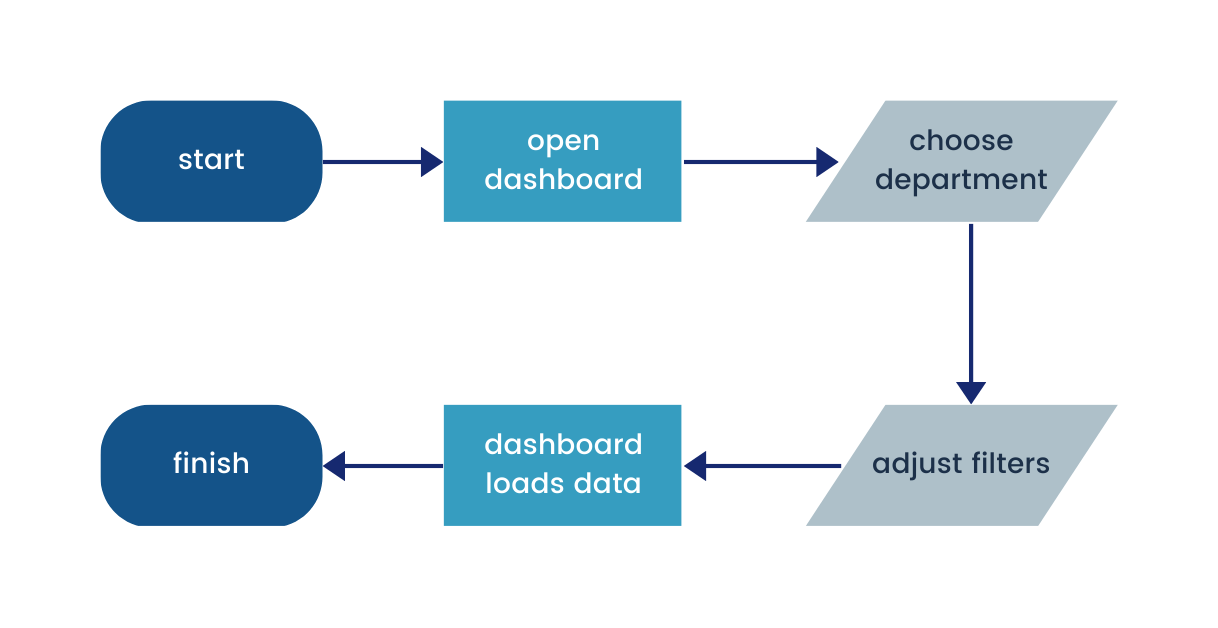 e-Commerce Company Dashboard User-Flow. Userflow applies to all pages across CVEWS Dashboard.
Simple Usage – Similar User-Flow for all departments.
Intuitive Filters – Adjust step in choosing department page and filters. Data on dashboard adapts based on adjustments on the filter.
Open for Improvements – Dashboard is always open for requests based on each department’s need. Requests will be queued on B.I. Team’s Pipeline.

Data Schemas
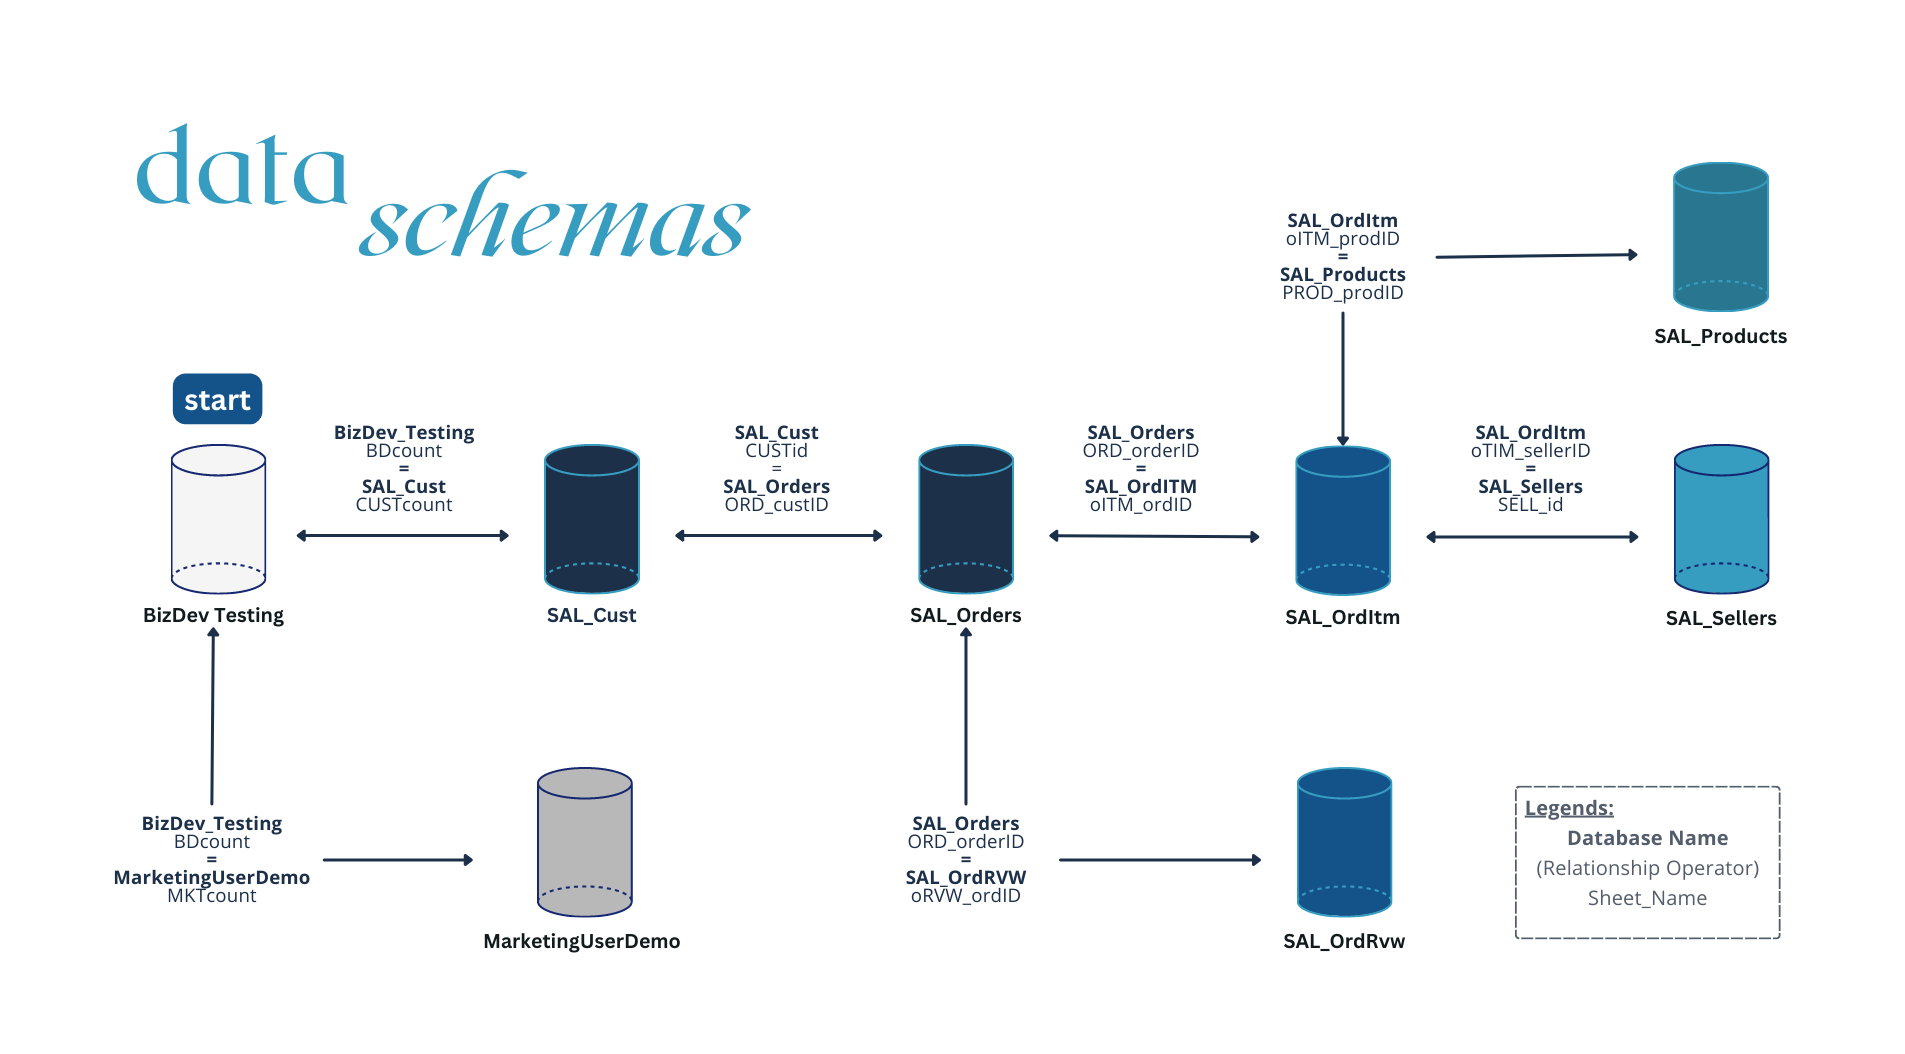
Data Schemas. Data schemas used in connecting cross-departmental dataset.

Dashboard Features
Control Panel. Main control panel to adjust information displayed within page. Feature is unavailable for Biz.Dev. department.
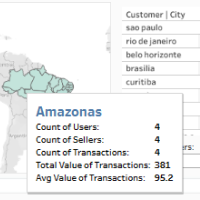
Tooltip. Additional information to support data visualization. Information varies based on graph and page chosen.
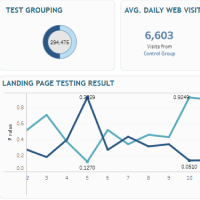
Bar, Line, and Donut Chart. Graphics used to aid data visualization. Donut Chart for categories, bar chart for categorical grouping, etc.
Links:
- Live Demo (ENG)
- Product Requirement Document (ENG)
- MVP Presentation (ENG)
- Project Report (ENG)